Manual Reference Pages - plot (3)
NAME
plot(3f) - [M_calcomp:basic] move with pen up or down or start new origin or terminate plotting (LICENSE:PD)
CONTENTS
Synopsis
Description
Options
Example
License
SYNOPSIS
subroutine plot(xpage,ypage,+-ipen)
DESCRIPTION
The PLOT subroutine is used to move the pen in a straight line to a new position, with the pen either up or down during the movement.
Another function of PLOT is to establish a new reference point (origin) for the current plot frame. This must be done if any draws or moves use values which are negative relative to the ORIGINAL frame origin.
PLOT also is used to terminate CALCOMP plotting, and must be called once and only once at the end of plotting calls in each CALCOMP application.
OPTIONS
XPAGE, YPAGE are the X, Y coordinates in CALCOMP inches. The values are measured relative to the current frame reference (origin). An origin (where both X, Y equal zero) may be established anywhere on the plotting surface by using negative IPEN values, as explained below.
Because CALCOMP routines are interfaced to write a TEMPLATE PDF, some limits on X and Y coordinates were required. All coordinate values (XPAGE, YPAGE) should be greater than or equal to zero and less than 100 inches. If negative values are necessary a new frame origin must be set so the negative values are positive relative to the ORIGINAL frame origin.
0 < XPAGE+origin x-offset < 100 0 < YPAGE+origin y-offset < 100
The values of XPAGE and YPAGE which are used to establish a new origin must also be considered. See the discussion under subroutine NFRAME for details.
+-IPEN is a signed integer which controls pen status (up or down), and the origin definition. If IPEN=2, the pen is down during movement, thus drawing a visible line.
If IPEN=3, the pen is up during movement.
If IPEN= -2, or -3, a new origin is defined at (XPAGE,YPAGE) after the movement is completed as if IPEN were positive.
That is, the X,Y coordinates of the new pen position are set equal to zero. This position is the reference point for succeeding pen movements.
If IPEN=999 the metalanguage file is closed. (Note this must be the last call made by the plotting application).
EXAMPLE
Sample program:
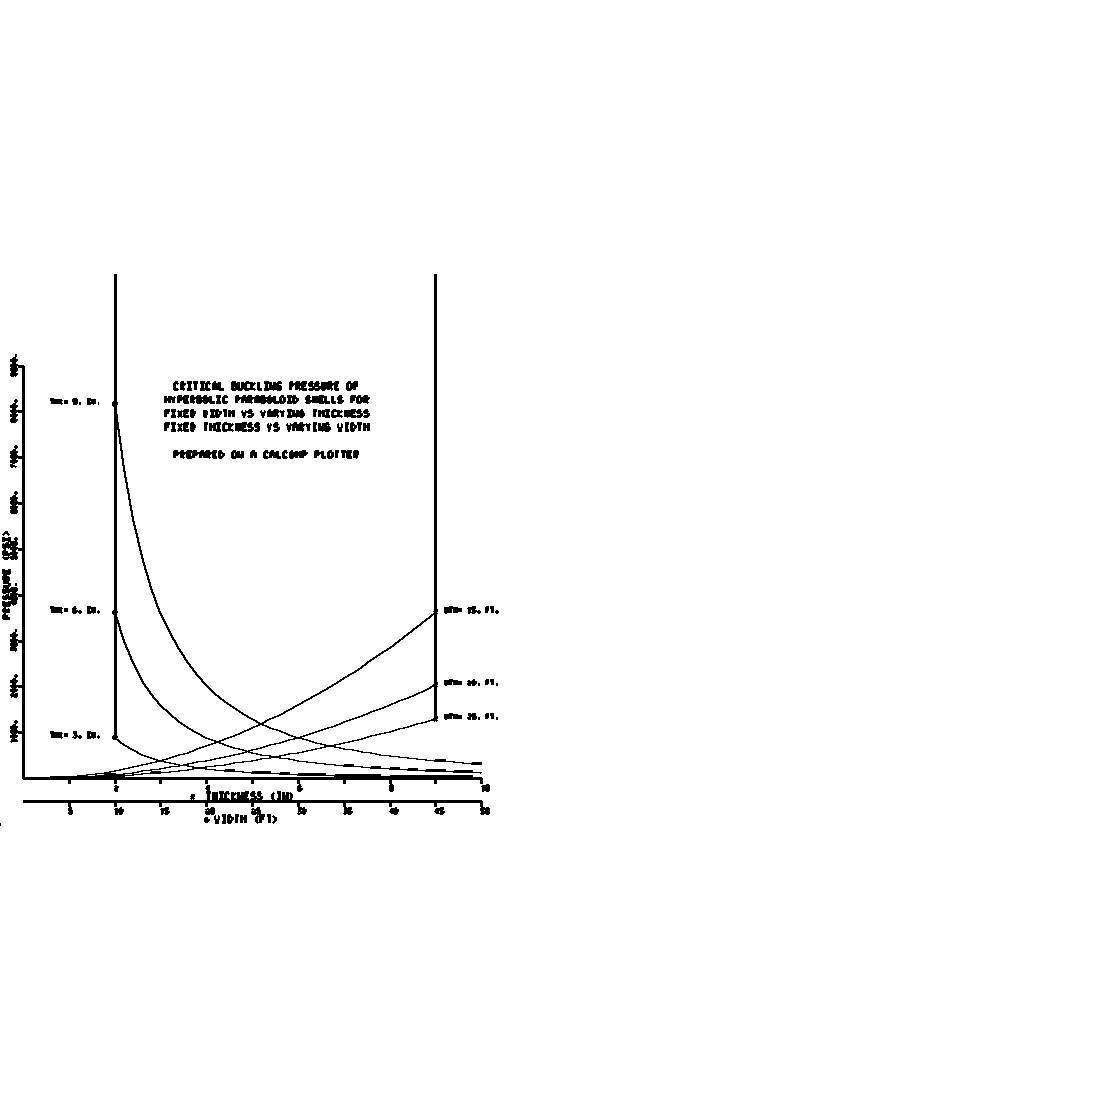
   program demo_plot
   use m_calcomp
   implicit none
   character(len=10),parameter :: ichr1=’WIDTH (FT)’
   character(len=14),parameter :: ichr2=’THICKNESS (IN)’
   character(len=14),parameter :: ichr3=’PRESSURE (PSI)’
   character(len=5),parameter  :: ichr4=’THK= ’
   character(len=4),parameter  :: ichr5=’ IN.’
   character(len=5),parameter  :: ichr6=’WTH= ’
   character(len=4),parameter  :: ichr7=’ FT.’
   character(len=29),parameter :: ichr8=’CRITICAL BUCKLING PRESSURE OF’
   character(len=32),parameter :: ichr9=’HYPERBOLIC PARABOLOID SHELLS FOR’
   character(len=32),parameter :: ichr10=’FIXED WIDTH VS VARYING THICKNESS’
   character(len=32),parameter :: ichr11=’FIXED THICKNESS VS VARYING WIDTH’
   character(len=32),parameter :: ichr12=’PREPARED ON A CALCOMP PLOTTER’
   character(len=1)            :: ibcd
   integer                     :: i,j
   integer                     :: inteq
   real                        :: x,y
   real                        :: psi
   real                        :: thick, wdth
   real                        :: tsqr, wsqr
   real                        :: tx, wx
      call plots(0.0,24.0,0.0,12.0)
   ! ESTABLISH AN ORIGIN SO NEGATIVE VALUES UP TO -0.5 MAY BE USED
      call plot(0.5,0.5,-3)
   ! PLOT X-AXIS FOR WIDTH
      x=0.0
      do i=1,10
         call plot(x,0.0,3)
         x=x+1.0
         call plot(x,0.0,2)
         call plot(x,-.1,2)
         call number(x,-0.25,0.1,5.0*x,0.0,-1)
      enddo
      call symbol(4.0,-0.40,0.12,ibcd,1,0.0,-1)
      call symbol(4.2,-0.45,0.14,ichr1,inteq,0.0,10)
      call plot(0.0,0.5,-3)
   ! PLOT X-AXIS FOR THICKNESS
      x=0.0
      do i=1,5
         call plot(x,0.0,3)
         x=x+1.0
         call plot(x,0.0,2)
         call plot(x,-.1,2)
         call plot(x,0.0,2)
         x=x+1.0
         call plot(x,0.0,2)
         call plot(x,-.1,2)
         call number(x,-0.25,0.1,x,0.0,-1)
      enddo
      call symbol(3.7,-0.40,0.12,ibcd,7,0.0,-1)
      call symbol(4.0,-0.45,0.14,ichr2,inteq,0.0,14)
   ! PLOT Y-AXIS
      y=0.0
      do i=1,9
         call plot(0.0,y,3)
         y=y+1.0
         call plot(0.0,y,2)
         call plot(-.1,y,2)
         call number(-.15,y-.2,0.1,1000.*y,90.0,0)
      enddo
      call symbol(-0.30,3.5,0.14,ichr3,inteq,90.0,14)
      thick=3.0
      wdth=25.0
      do i=1,3
         tsqr=thick*thick
         wsqr=wdth*wdth
         psi=100.99*tsqr
         call symbol(0.6,psi/1000.0,0.1,ichr4,inteq,0.0,5)
         call number(999.0,999.0,0.10,thick,0.0,0)
         call symbol(999.0,999.0,0.10,ichr5,inteq,0.0,4)
         call symbol( 2.0, 999.0,0.12,ibcd,1,0.0,-1)
         do j=10,50
            wx=real(j)
            psi=10099.0*tsqr/(wx*wx)
            call plot(wx/5.0,psi/1000.0,2)
         enddo
         psi=10099.0*81.0/wsqr
         call symbol(9.2,psi/1000.0,0.1,ichr6,inteq,0.0,5)
         call number(999.0,999.0,0.10,wdth,0.0,0)
         call symbol(999.0,999.0,0.10,ichr7,inteq,0.0,4)
         call symbol( 9.0, 999.0,0.12,ibcd,7,0.0,-1)
         do j=5,50
            tx=(50.0-real(j))/5.0
            psi=10099.0*tx*tx/wsqr
            call plot(tx,psi/1000.0,2)
         enddo
         thick=thick+3.0
         wdth=wdth-5.0
      enddo
      call symbol(3.3,8.5,.14,ichr8,inteq,0.0,29)
      call symbol(3.1,8.2,.14,ichr9,inteq,0.0,32)
      call symbol(3.1,7.9,.14,ichr10,inteq,0.0,32)
      call symbol(3.1,7.6,.14,ichr11,inteq,0.0,32)
      call symbol(3.3,7.0,.14,ichr12,inteq,0.0,29)
      call plot(0.0,0.0,999)
   end program demo_plot
LICENSE
Public Domain
| plot (3) | March 11, 2021 |
