Manual Reference Pages - line (3)
NAME
line(3f) - [M_calcomp:basic] plot a polyline with optional rescaling (LICENSE:PD)
CONTENTS
Synopsis
Description
Options
Examples
License
SYNOPSIS
subroutine line(xarray,yarray,npts,inc,+-lintyp,inteq)
DESCRIPTION
Plots a series of XY points with optional rescaling.
The LINE subroutine produces a line plot of the pairs of data values in two arrays (XARRAY and YARRAY). LINE computes the page coordinates of each plotted point according to the data values in each array and the respective scaling parameters. The data points may be represented by centered symbols and/or connecting lines between points.
The scaling parameters corresponding to FIRSTV and DELTAV (see SCALE) must immediately follow each array. If these parameters have not been computed by the SCALE subroutine they must be supplied by the user. If scaling is not required, the user must place the appropriate minimum and delta values in the specified elements of the arrays. For a one-to-one correspondence between array data and plotted data, these values should be 0.0 (minimum) and 1.0 (delta).
OPTIONS
XARRAY is the name of the array containing the abscissa (X) values and the scaling parameters for the X array. YARRAY is the name of the array containing the ordinate (Y) values and the scaling parameters for the Y array. NPTS is the number of data points to be plotted in each of the two arrays just mentioned. The number does not include the extra two locations for the scaling parameters. The number of points in each array must be the same. INC is the increment that the LINE subroutine is to use in gathering data from the two arrays, as described previously for the SCALE subroutine. XARRAY and YARRAY must be dimensioned NPTS*INC+INC+1.0 +-LINTYP is a control parameter which describes the type of line to be drawn through the data points. The magnitude of LINTYP determines the frequency of plotted symbols. If LINTYP is zero, the points are connected by straight lines but no symbols are plotted.
If LINTYP=1, a line plot with a symbol at each data point is produced.
If LINTYP=n, a line plot connects every data point defined in the array; a symbol is drawn at every nth data point. (The pen is up when moving from its current position to the first point.) For example, if LINTYP=4, a special symbol (denoted by INTEQ) is plotted at every fourth data point. If LINTYP=-n, no connecting lines are drawn; only the symbols are plotted, at every nth data point.
INTEQ is the integer equivalent of the special plotting symbol centered at each data point. This value normally can be 0 through 14 (see Table 2), and has meaning only when LINTYP is not zero. Some of these symbols are as follows: box, octagon, triangle, plus, X, diamond, and asterisk.
EXAMPLES
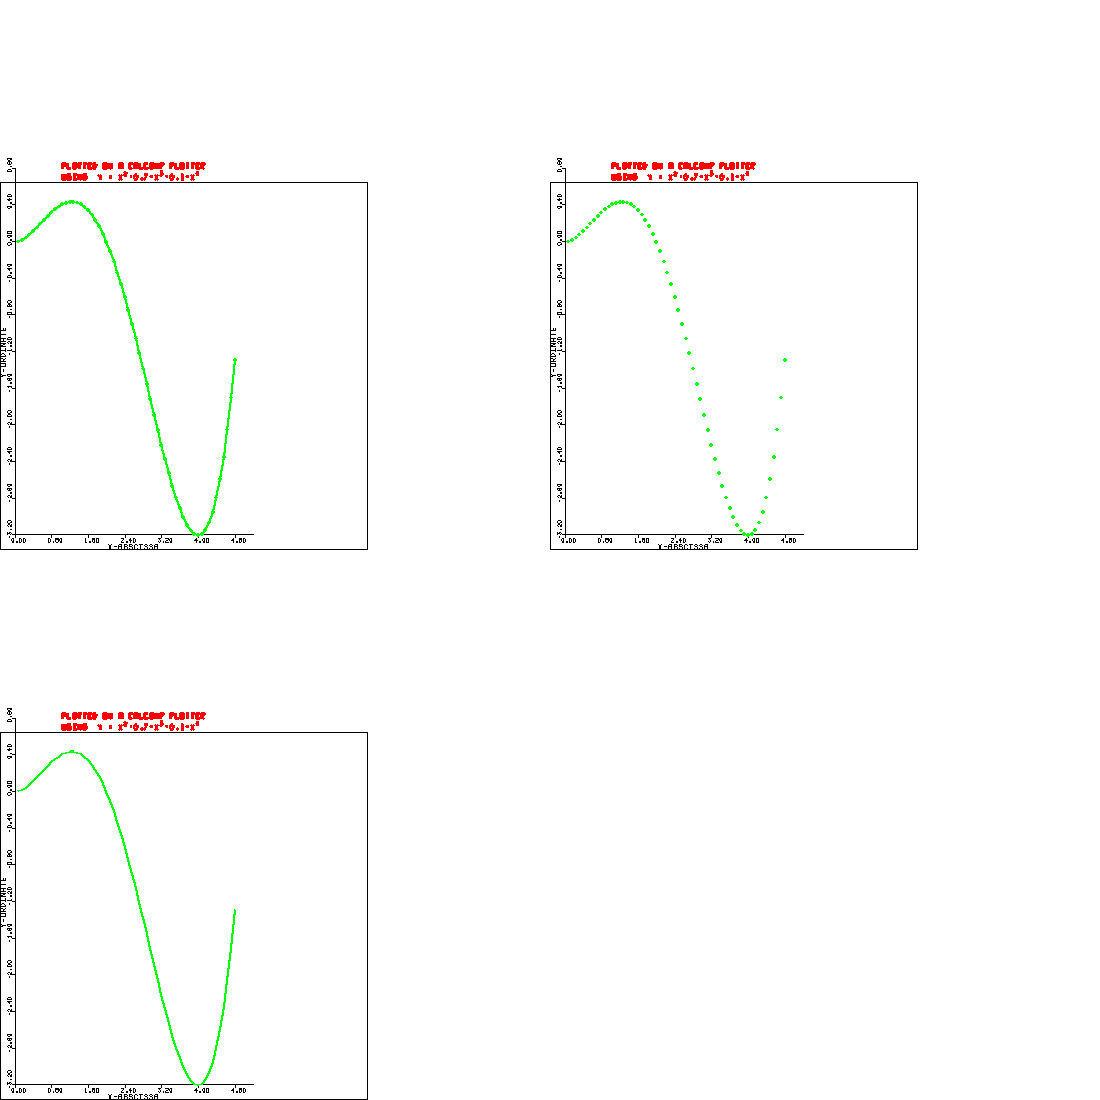
Sample program:
   program demo_line
   use M_calcomp
   call plots(0.0,30.0,0.0,30.0)
   call drawplot(0) ! solid line
   call plot( 0.0,15.0,-MOVE)
   call drawplot(1) ! symbol at each point and line
   call plot( 15.0, 0.0,-MOVE)
   call drawplot(-1) ! symbol at each point and no line
   call plot(0.0,0.0,999)
   contains
   subroutine drawplot(linetype)
   character(len=28) :: ichr1
   character(len=26) :: ichr2
   character(len=10) :: lbcd1,lbcd2
   dimension xarray(62),yarray(62)
   ICHR1=’PLOTTED ON A CALCOMP PLOTTER’
   ICHR2=’USING  Y = X -0.7*X +0.1*X’
   LBCD1=’X-ABSCISSA’
   LBCD2=’Y-ORDINATE’
   ! PLOT GRAPH ILLUSTRATING SCALE, AXIS, AND LINE
   deltax=0.04
   ! AXIS DRAWS LABELS AS MUCH AS 0.4 INCHES TO THE NEGATIVE OF AXIS CENTER;
   ! EITHER USE AN ORIGIN OFFSET OF AT LEAST THIS VALUE OR DO NOT USE AN
   ! ORIGIN VALUE OF LESS THAN 0.4 OR CLIPPING WILL OCCUR
   call width(0)
   call newpen(WHITE)
   call rect(0.0,0.0,10.0,10.0,0.0,7)
   call plot(0.4,0.4,-3)
   deltax=2.0*deltax
   xarray(1)=deltax
   do j=1,60
      yarray(j)=xarray(j)**2-0.7*xarray(j)**3+0.1*xarray(j)**4
      xarray(j+1)=xarray(j)+deltax
   enddo
   inteq=4
   call scale(xarray(1), 6.5,60,1)
   call scale(yarray(1),10.0,60,1)
   call axis(0.0,0.0,lbcd1,-10, 6.5, 0.0,xarray(61),xarray(62))
   call axis(0.0,0.0,lbcd2, 10,10.0,90.0,yarray(61),yarray(62))
   call width(20)
   call newpen(GREEN)
   call line(xarray(1),yarray(1),60,1,linetype,inteq)
   call newpen(1)
   call symbol(1.3,10.,.14,ichr1,inteq,0.0,28)
   call symbol(1.3,9.7,.14,ichr2,inteq,0.0,26)
   call number(2.98,9.8,.1,2.0,0.,-1)
   call number(3.96,9.8,.1,3.0,0.,-1)
   call number(4.94,9.8,.1,4.0,0.,-1)
   call plot(-0.4,-0.4,-3)
   end subroutine drawplot
   end program demo_line
LICENSE
Public Domain
| line (3) | March 11, 2021 |
