Manual Reference Pages - axis (3)
NAME
axis(3f) - [M_calcomp:basic] draw linear axis with numeric scale and axis label (LICENSE:PD)
CONTENTS
Synopsis
Description
Options
Examples
License
SYNOPSIS
subroutine axis(xpage,ypage,ibcd,+-nchar,axlen,angle,firstv,deltav)
DESCRIPTION
Draws a linear axis with numeric scale and axis label.
Important: Axis labels can be 0.4 inches lower than or to the left of the axis origin (XPAGE,YPAGE). Since lines drawn whose value is negative relative to the frame’s ORIGINAL origin will be clipped, XPAGE and YPAGE must be greater than 0.4 or a new origin must be specified at least 0.4 units up and to the right from the original using PLOT(0.4,.4,-3) when (XPAGE,YPAGE) is (0.0,0.0).
Most graphs require axis lines and scales to indicate the orientation and values of the plotted data points. The most common type of scaled axis is produced by the AXIS subroutine which draws any length line at any angle, divides the line into one-inch segments, annotates the divisions with appropriate scale values and labels the axis with a centered title. When both the X and Y axes are needed, AXIS is called separately for each one.
OPTIONS
XPAGE,YPAGE are the coordinates, in inches, of the axis line’s starting point. The entire line should be at least one-half inch from any side to allow space for the scale annotation and axis title. Usually, both the X and Y axes are joined at the origin of the graph, where XPAGE and YPAGE equal zero, but other starting points can be used. When using the LINE subroutine to plot data on an axis, at least one of the coordinates must be 0, i.e., for an X axis, XPAGE=0, and for a Y axis, YPAGE=0 . IBCD is the title, which is centered and placed parallel to the axis line. This parameter may be a character array or single variable. (The data should be stored as TYPE CHARACTER.) The characters have a fixed height of 0.14 inch (about seven characters per inch). +-NCHAR The magnitude specifies the number of characters in the axis title, and the sign determines on which side of the line the scale (tick) marks and labeling information shall be placed. Since the axis line may be drawn at any angle, the line itself is used as a reference. If the sign is positive, all annotation appears on the positive (counterclockwise) side of the axis. This condition is normally desired for the Y axis.
If the sign is negative, all annotation appears on the negative (clockwise) side of the axis. This condition is normally desired for the X axis.
AXLEN is the length of the axis line, in inches. ANGLE is the angle in degrees (positive or negative), at which the axis is drawn. The value is 0 degrees for the X-axis and 90 degrees for the Y-axis. FIRSTV is the starting value (either minimum or maximum) which will appear at the first tick mark on the axis. This value may either be computed by the SCALE subroutine and stored at subscripted location ARRAY(NPTS*INC+1), or the value may be determined by the user and stored at any location. This number and scale value along the axis is drawn with two decimal places. Since the digit size is 0.105 inch (about 10 characters per inch), and since a scale value appears every inch, no more than six digits and a sign should appear to the left of the decimal point.
DELTAV represents the number of data units per inch of axis. This value (increment or decrement), which is added to FIRSTV for each succeeding one-inch division along the axis, may either be computed by SCALE and stored beyond FIRSTV at ARRAY(NPTS*INC+INC+1), or the value may be determined by the user and stored at any location. In order to use a standard format of two decimal places, the size of DELTAV is adjusted to less than 100, but not less than 0.01. As a result, the decimal point may be shifted left or right in the scale values as drawn, and the axis title is then followed by "*10**n", where n is the power-of-ten adjustment factor. (See X-axis example in Figure _____.)
EXAMPLES
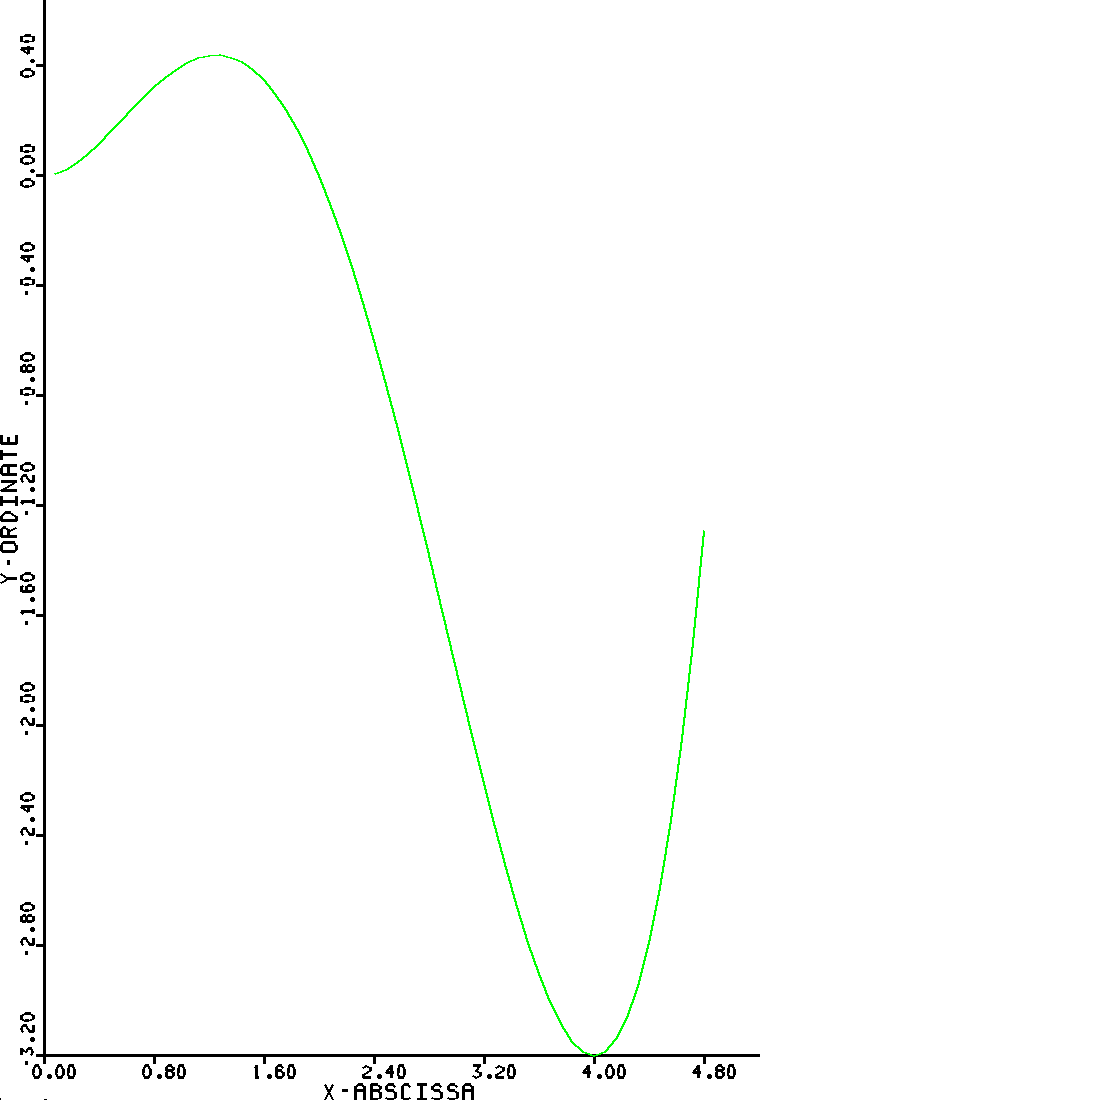
Sample program:
   program demo_axis
   use M_calcomp
   character(len=28) :: ichr1
   character(len=26) :: ichr2
   character(len=10) :: lbcd1,lbcd2
   dimension xarray(62),yarray(62)
   ICHR1=’PLOTTED ON A CALCOMP PLOTTER’
   ICHR2=’USING  Y = X -0.7*X +0.1*X’
   LBCD1=’X-ABSCISSA’
   LBCD2=’Y-ORDINATE’
   call plots(0.0,10.0,0.0,10.0)
   ! PLOT THREE GRAPHS ILLUSTRATING SCALE, AXIS, AND LINE
   deltax=0.04
   i=2
   ! AXIS DRAWS LABELS AS MUCH AS 0.4 INCHES TO THE NEGATIVE OF AXIS CENTER;
   ! EITHER USE AN ORIGIN OFFSET OF AT LEAST THIS VALUE OR DO NOT USE AN
   ! ORIGIN VALUE OF LESS THAN 0.4 OR CLIPPING WILL OCCUR
   call plot(0.4,0.4,-3)
   deltax=2.0*deltax
   xarray(1)=deltax
   do j=1,60
      yarray(j)=xarray(j)**2-0.7*xarray(j)**3+0.1*xarray(j)**4
      xarray(j+1)=xarray(j)+deltax
   enddo
   call scale(xarray(1), 6.5,60,1)
   call scale(yarray(1),10.0,60,1)
   call axis(0.0,0.0,lbcd1,-10, 6.5, 0.0,xarray(61),xarray(62))
   call axis(0.0,0.0,lbcd2, 10,10.0,90.0,yarray(61),yarray(62))
   call newpen(i)
   call line(xarray(1),yarray(1),60,1,2*(i-2),i)
   call newpen(1)
   call symbol(1.3,10.,.14,ichr1,inteq,0.0,28)
   call symbol(1.3,9.7,.14,ichr2,inteq,0.0,26)
   call number(2.98,9.8,.1,2.0,0.,-1)
   call number(3.96,9.8,.1,3.0,0.,-1)
   call number(4.94,9.8,.1,4.0,0.,-1)
   !call plot(10.0,0.0,-3)
   call nframe()
   call plot(0.0,0.0,999)
   end program demo_axis
LICENSE
Public Domain
| axis (3) | March 11, 2021 |
